The first thing that the users will see once they login into the Merchant portal is the Home Page. The home page is the start point for the Merchants to start navigating on the Merchant Portal and it will show the Dashboards View.
The Dashboards View
The Dashboards are a graphical representation or a snapshot of how Merchant’s business behaved in a determined period. This is a very powerful and simplistic tool for the merchant to understand what is going on with his business.
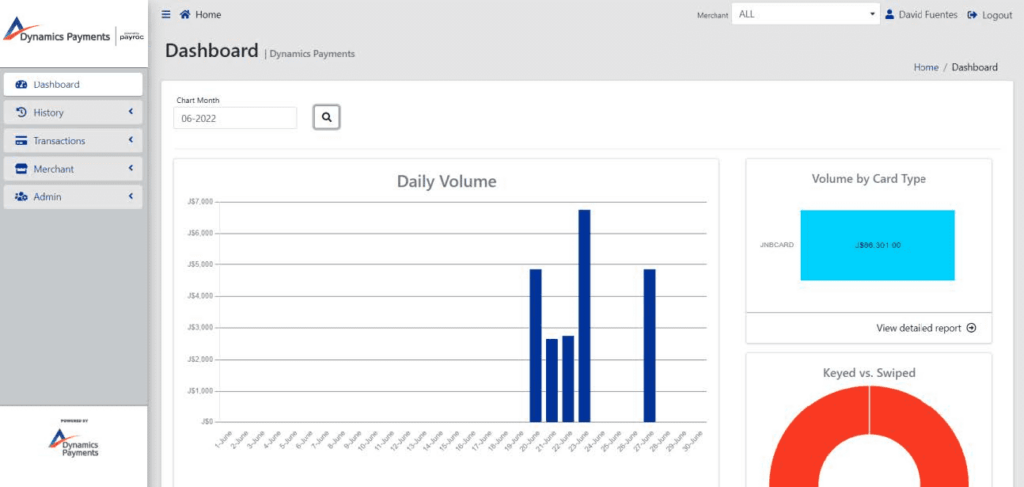
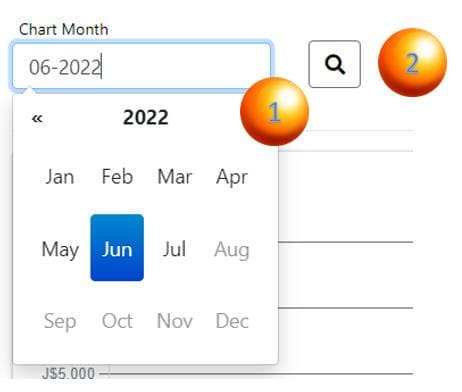
The Dashboards view will always show the information for the current month of the year. To navigate through your historical data on this view, select the desired month on the “Chart Month” filter and click the search Button.
The dashboards on the Dashboard view are pretty intuitive and are identified by name. Another interesting feature is that the Dashboards are interactive.
This means that if the merchant clicks on a specific dashboard, the view will be redirected to a detail view specific to the dashboard that was clicked.
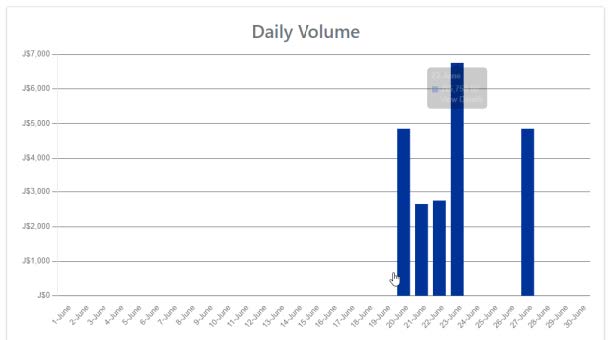
The Daily Volume Dashboard will indicate the income related to daily transactions that the business has produced on the selected month.
One click on this Dashboard or on the label “View detailed report” will redirect the merchant to the specific Batch-detail view for the selected day that was clicked.
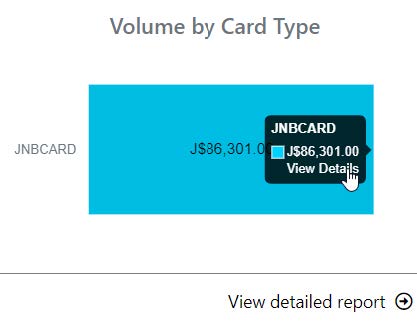
The Volume by Card Type Dashboard will indicate the total amount of income, of the selected month, and identified by card type that was used. For example: The total amount of MERCHANTB Cards for the month of June 2022.
One click on this Dashboard or on the label “View detailed report” will redirect the merchant to the specific Transactions-detail view for the selected month.
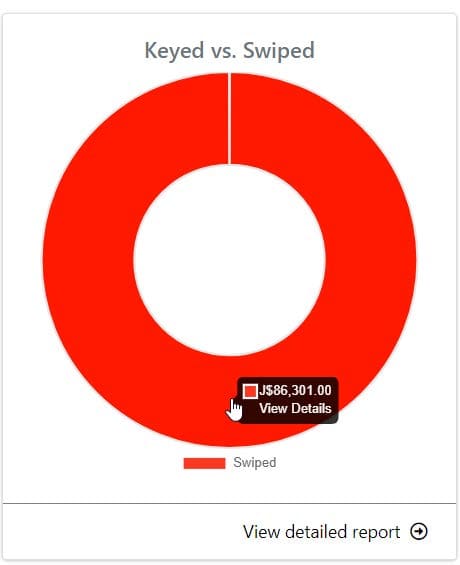
The Keyed Vs. Swiped Dashboard will indicate the total amount of income, of the selected month, and identified by the type of transaction (Keyed or Swiped) that was used. For example: The total amount of Swiped transactions for the month of June 2022.
One click on this Dashboard or on the label “View detailed report” will redirect the merchant to the specific Transactions-detail view for the selected month.